Do you ever hear someone that you agree with use a terrible argument in a debate and shudder? Their position is the same as yours, but they’ve just used a questionable or downright misleading premise to back it up, weakening your position by association and opening you up to straw-man attacks. Now you’re locked into a debate within a debate, and nobody seems happy.
I’ve been there, on both sides. I’ve repeated some talking point I picked up without checking it first only to get called out, then furiously do 15 seconds of research on my phone that only confirms I’m wrong, then end up ashamed that I blindly accepted an argument just because it seemed to perfectly line up with the point I was trying to make. Why couldn’t I have just used a better argument?
I guess fake news is catchy on a Facebook feed, but that’s not the only culprit here. Real news, or “technically accurate” arguments presented in a way that is clearly misleading to people who are familiar with the area can be even worse. So I’ve decided I’m going try to call out some of these bad arguments and offer better substitutes in a series I’ll call “Say this, not that,” inspired by the popular healthy eating guide (Although more often than not I still choose “this” over “that” when it comes to their suggestions).
Today’s topic is a jobs-related talking point in favor of solar energy that has come up recently following President Trump’s recent decision to put a 30% import tax on solar panels among other things. I have discussed this topic before (these assertions are mostly based on energy job analysis that is a year old), but the headlines I keep hearing repeated seem to be particularly egregious now and increasingly cited without regard for the full content of the underlying articles or the broader energy picture.
Not content to merely indicate that the U.S. solar industry has created a lot of jobs (supporting a substantial 260,777 workers that spend greater than half their time on solar projects and an additional 113,730 jobs where people spend some portion of their time on solar projects), what I now hear is that Solar represents “more jobs than oil, gas, and coal combined.” This argument is not new and was already true last year, if limited to jobs relating to electrical power generation, as noted in this Forbes article. Other outlets such as like IFLS, ran with a headline reading “Solar Employs More People Than Oil, Coal, And Gas Combined In The US”. Other offenders were the Natural Resources Defense Council (U.S. Clean Energy Jobs Surpass Fossil Fuel Employment), The Independent (US solar power employs more people than oil, coal and gas combined, report shows).
Don’t get me wrong, that solar is employing such a large percentage of the electric power generation workforce is impressive, even if these jobs aren’t creating the most energy per job (that’s a different topic that I beat to death earlier and you can read about here). However, the number of solar jobs overall aren’t even close to the number of jobs that oil and gas creates because most oil and gas does not go into electric power generation. This is because, electric power generation only represents a relatively small slice of the US energy picture.
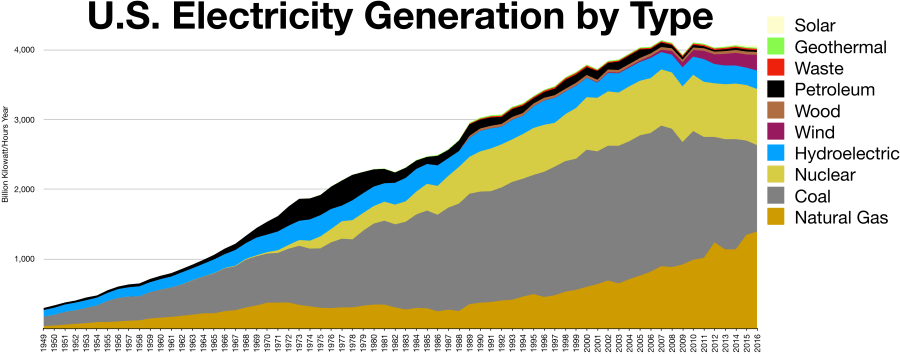
A few sources[i] peg the United States’ total electrical energy consumption from all sources at around 4,000,000,000,000 kilowatt hours (abbreviated kW-hr) per year. That’s the number four followed by 12 zeroes, and for reference a 60 watt light bulb would theoretically consume 1 kW-hr about once every 17 hours. Even converted to barrels of oil equivalent, this is an impressive 2,400,000,000 barrels per year, or about 6.5 million barrels per day. However, it is still important to note that despite creating a large number of jobs, for the 12 month period ending October 2017, Solar power in the US has had only produced 51,800,000,000 kW-hr, or a little over 1% of annual electric consumption in the US. Here’s a graph that show’s how production numbers break down[ii].
If my math is right, Solar’s production is the rough equivalent of 83,500 barrels of oil per day. For comparison, the U.S. consumes close to 20 million barrels of actual oil per day (about a fifth of the total world consumption) and is expected to produce over half that amount. In addition, the US consumes about 27.5 trillion standard cubic feet of natural gas, about 13 million barrels of oil equivalent per day, and is projected to produce even more gas than it consumes.
As for how absurd the lack of the qualifier “electric power” caveat skews the jobs argument: For US jobs overall, Oil supports 502,678 jobs, only 12,840 of which are associated with electric power generation. Natural Gas supports 392,869 jobs, only 88,242 of which are associated with electric power generation. If you want to see all the numbers yourself, they’re actually presented in a really clear fashion in the Department of Energy’s U.S. Energy and Employment Report published in January 2017 (link), which I would note is the same report on which all of the aforementioned articled were based.
This is where I should probably mention that article headlines are engineered to be clickbait, and in most media aren’t even written by the author of the story, but instead by people marketing the story in a way that attracts the most viewers.
So for this round of debate on the 30% tariff on cheap solar panels from China, please don’t tell me Solar generates more jobs than Oil and Gas, that is wrong. Don’t even tell me Solar generates more jobs within the electric power generation sector, which while technically correct sounds weak and opens the Solar industry to (unfair) attacks of lagging efficiency on a per job-basis. Instead, mention that the Solar industry already employs hundreds of thousands of Americans and is still growing incredibly quickly. Mention that solar power emits no CO2. Mention that Solar could provide a way to eliminate many of the environmental and safety risks associated with hydrocarbon exploration and production; Curtailing the need for energy firms to explore production of sources areas that are controlled by hostile governments, or that are environmentally sensitive, or contain oil that is costly or dangerous to produce.
Most importantly, acknowledge that there are no silver bullets to the world’s energy issues, and listen to the people you are arguing with, even if they seem like your ideological opposite. They probably have some good points and ideas too, and in my experience people are much more likely to consider your evidence if you hear them out first.
[i]http://bfy.tw/GETM Yeah, I’m feeling that lazy with the endnote references today.
This is a topic that has been written about a million times already and many of you reading this will know most of the things I am about to write. However, for my friends who don’t follow the industry or never took a macroeconomics class, this is something I find interesting and therefore believe you will as well. I hereby declare a hearty “You’re Welcome” for publishing this article that none of you asked for[i].
Here’s the short version: Oil costs money to extract from a reservoir, and the amount of money it costs to produce varies wildly based on the oil reservoir location, physical properties, and method of extraction among other variables. Some of the world’s oil can be produced profitably at $20, but a lot more can be produced profitably at $100. The price point at which oil production shifts from a money loser to money maker is referred to as the “breakeven” price.
“Breakeven” price is often used to describe specific oil fields or types or even companies themselves. If more oil is produced than is used, usually due to higher production or reduced demand, oil inventories start to grow and the price of oil drops until inventory levels stabilize again. If oil prices are low enough, this stabilization can occur because oil producers simply shut off production from sources that have higher breakeven prices than the current price of oil. For example, a well with a breakeven point of $45/barrel may be produced when the price of oil is $50, but shut down when the price falls to $40 to avoid losing money. If enough wells are shut off that inventories return to normal levels, prices should stabilize around the new point.
Although how quickly production is shut down depends on how easily is it to stop and restart production and short term price projection, this drop in price will cause some of the oil production with the highest breakeven price to stop. This in theory rebalances supply and demand, stops the growing inventory, and stabilizes the price of oil. Well, in theory.
Alright, so that is the basics. Let’s look at some of the variables[ii] at play here. To keep things somewhat manageable, fort his post I’ll limit my scope to looking at oil cartels, increased production from fracking companies, inventory, and trading Impacts on oil price.
Price Fixing and Oil Cartels
Because of historic uncertainty around oil price due in large part to periodic flooding of the oil market with new production that caused price collapses, oil cartels such as the Texas Railroad Commission or the Organization of the Petroleum Exporting Countries (OPEC) have spent most of the last century trying to stabilize (or maximize, depending on who you ask) the price of oil by restricting member production to balance supply with demand. The word “cartel” generally has a negative connotation in the US because price fixing is a decidedly un-capitalistic behavior for private players. The activities of the Texas Railroad Commission on private producers were constrained to only prevent physical waste associated with improper extraction of oil and not allowed to impose production to prevent “economic waste” associated with price crashes[iii]. This role has fallen to OPEC for the last 60 years.
It would be an understatement to say that OPEC was not very popular with most people I knew in college in the mid-2000’s when oil prices soared and it began costing over $20[iv] to fill up gas tanks like the one in my 1992 Chrysler New Yorker. However, since oil is traded on the world market, OPEC’s imposition of production restrictions have provided assistance US suppliers by allowing them to produce at a much less restrained rate by preventing them from bearing the burden of price collapses that would have occurred had all oil producers continued seeking to maximizing their own output.
Of course, the US has long been a net-importer of oil and thus the maximized profits of these US companies has come largely from the hands of US consumers, but the profit has at least been disproportionately transferred to US producers over OPEC members as US producers. US producers have been rapidly eating away at OPEC’s access to the US market with the explosion of production that has occurred in the last few years. This is why OPEC decided not to cut production in 2014, to protect their market share against the rapidly growing US producers that would have benefitted from these cuts. By many accounts, this tactic to allow the price to crater to drive US production out of the market has not succeeded as well as OPEC had hoped, and they have since reversed course with a series of cuts that should continue through 2018.
Frackers Won’t Die
OPEC’s move was transparent, and while many small companies may have driven out of business by the move, many are kept afloat by their investors and continue to plug along posting loss after loss because a rebound in oil price would quickly erase those losses and them some. It also doesn’t hurt that there is a lot of extra capital in the world that people are desperate to put anywhere, inflating the value of stocks, housing, Snapchat, and whatever else might continue to rise in value[v].
The broader, non-oil market may or may not be about to crash, but the potential downside does seem to be growing relative to the upside. The same thing can’t necessarily be said about many smaller oil stocks, which can be had at a tiny fraction of what they cost a few years ago. A sudden swing in oil inventories, unrest in a major oil producing nation, or any number of factors could send the oil price back to 60 or 70 dollars, which would probably be enough to double or triple the value of some of these firms, especially ones that have found ways to more efficiently make production targets and chip away at their breakeven price. They could go to 0 as well, but that’s part of the fun I suppose.
As long as this extra production stays online, OPEC will have trouble balancing oil supply without continued output cuts. Additionally, as these companies get more efficient in how they produce oil and continue to grow their production and reduce their breakeven price, they could end up setting, and gradually lowering, a price ceiling in the oil market. The theory is that if there is a large chunk of production with similar per barrel production cost, the price will have trouble overshooting this production breakeven cost for long periods of time, if their supply ends up representing the key barrels of oil that causes global inventory increase rather than decrease or stay flat.
By the way, this is probably a good time to point out that I am right now (On January 19th, 2018) continuing a half-finished post, which based on the timestamp was last saved on June 8th, 2017. Since then, prices have turned around dramatically and as of this moment, WTI (US Marker Crude) is sitting at $63.45 per barrel while Brent (UK Marker Crude) is at $68.68 per barrel. As for my prediction with regards to price, most larger oil producing and refining companies have done very well in the last 7 months, but so has the overall market. Smaller companies that have taken on a lot of debt have not really double or tripled in stock price, although the value of their production has certainly increased. I suppose the market did a good job of pricing in the eventual turnaround in price, but the jury is still out for a lot of companies on how well the higher prices will allow them to emerge from their piles of debt. This seems like the part where I disclose that I own a small stake of Chesapeake Energy Corporation (CHK), which hasn’t yet seen its price rebound along with oil and seems to be constantly zipping along a knife’s edge when it comes to solvency (you can do it, buddy!).
Inventory Management
Oil inventories is a word you hear a lot when hearing industry financial news. They serve as a buffer to differences between supply and demand, and because of this the quantity and rate of change in oil inventory becomes one of the key drivers of oil price as mentioned earlier. When more oil is used than produced, there is a drawdown on oil inventories to make up the difference, while inventories increase when excess oil is produced. However, because inventory represents actual physical oil in a location, different places can have different inventories and different ways of tracking it. Some have said that OPEC governments intentionally shifted inventory away from the US and to other countries because the US inventory is more rigorously tracked, while oil could hide in other markets. Additionally, there is quite a bit of floating inventory in the world, tankers loaded with oil wandering about while prices are low, although improving markets started to reverse this trend in late 2017. Of course, even poorly tracked inventory can’t hide forever, but any increase in oil price until it returns is free money in the seller’s pocket. Current world energy consumption is nearly 100 million barrels of oil per day[vi], which means that every day the price is increased by a dollar represents an additional $100 million dollars in profit every day. Stretch that one extra dollar out for a whole year and you can split and extra 36.5 billion dollars between the world’s oil producers.
Trading
Regardless of what is happening, the price of oil is going to be set by those buying and selling it. In 2007 when I was graduating college and oil prices were surging, oil speculators were a common bogeyman for people alleging price inflation. Although traditional economics would suggest that an efficient world market would consider all of off the important, publicly-known factors and dictate a price perfectly in line with those, weird things happen in the oil market and you end up with situations where oil reaches impossible to maintain highs (>$150/bbl in 2008) and lows (<$30/bbl in early 2016).
Before I talk about traders, I should mention something that makes the oil market harder than other. An Important factor driving swings in prices is the relative inelasticity of the demand curve for oil. That last sentence was full of pretentious business words, but think of it this way: Say you love Cracklin’ Oat Bran, which costs $3.89 per box at Target right now[vii]. Would you still buy that cereal if the price tripled to $12? OK, there’s not a great replacement cereal for Cracklin’ Oat Bran, so maybe you would, but overall sales would probably plummet immediately. However, if your car ran on Cracklin’ Oat Bran and you needed it to get to work, you probably wouldn’t run out and buy a car that used less Cracklin’ Oat Bran, or a new house that required you to fill up your Cracklin’ Oat Bran tank less often[viii].
To be honest, when gas prices skyrocket last, I didn’t even go out and check the air pressure in my tires, which was the go-to ‘helpful’ recommendation everyone tried to give for decreasing oil consumption. Sorry, saving 0.6% of my gasoline bill on average is not worth my time regardless of what the price is, try harder. Speaking of that…
Don’t even get me started on this nonsense.
So back to traders. Many oil traders are companies trying to hedge their bets to avoid a financial shock due to shifting oil prices. Though they can make quite a bit when prices shift suddenly, they can just as easily find themselves on the wrong side of that same trade. This means that while speculation can exacerbate prices, it’s not as if the traders are the ones reaping the reward at your expense. Instead, a lot of that money is traded between the people doing the trading, and the people that make the good (or lucky) trades end up making money from the people doing the bad trades, allowing you to rest comfortably with the knowledge that most of the money you spend at the gas station is still going to the good folks that get oil from the ground and into your car and not traders pushing money around. Or if you don’t work for a major oil company like me and you don’t really care why the price is dumb sometimes, at least you clearly have a lot of free time to get to the end of a long article like this one.
There’s a lot more I could write on oil prices, but this has already become a lot longer than I intended, and I should probably just post this before I get sidetracked for another 7 months and the market changes in a way that invalidates everything I said. Thanks for reading, let me know what you think in the comments.
[i] I assume if you clicked on this article you and I at least share some of the same interests, and there is scientific evidence that if you and I share the same preferences then you may also find this interesting. From the American Psychological Association 2010, Vol. 46, No. 2 Article entitled Children Reason About Shared Preferences, Christine A. Fawcett and Lori Markson from UC Berkeley explain:
In sum, the present study shows that by the third year of life, children are capable of recognizing another’s preference, determining whether that preference matches their own, and using this knowledge to make inferences about that person’s behavior to guide their own decisions.
Therefore, anyone who clicks this article and thinks that I am being presumptuous to assume you would find this interesting is either a liar or lacks the developmental maturity of most 2-year-olds.
[ii] I love using the word “variables,” it makes any analysis sound scientific and gives it the veneer of mathematical rigor, even when it’s dumb business garbage where people are basically trying to guess how much money a bunch of guys in New York can create out of thin air. As you can see, my grasp on basic business concepts is incredibly strong.
[iii] For more information on the Texas Railroad Commission’s efforts to restrict oil production to prevent economic and physical waste (as well as the entire history of oil) I would suggest reading Daniel Yergin’s The Prize. However, for those of you that don’t have time for an 800 page biography of oil there’s a very short version of the mission of the TRC here: https://www.tsl.texas.gov/exhibits/railroad/oil/page6.html
[iv] I began driving myself to high school after I turned 16, and my parents would reimburse me for one tank of gas a week. To maximize the amount I could drive I would let the tank get as close to dry as possible. I remember wishing I had printed a receipt the week my fill up cost $23 and my Dad seemed certain I was lying. Also, I’m guessing I had gleefully skipped into the house and informed him of this cost like a smug entitled jerk, which at 32 I now realize was probably the bigger issue.
[v] After spiking and crashing during the beginning of the great recession, S&P 500 price to earnings ratios have risen steadily for the past several years, gradually inflating the value of the companies in the index relative to the actual earnings those companies report (see http://www.multpl.com/table). People have used P/E ratio to say the market is overvalued for at least the last two years, but the money keeps flowing into the market. Although I say this is relation to almost everything, someone must know something I don’t.
[vii] Dang, I’ve actually paid $5.50 for a box of that cereal before, but mostly because I was bringing it to a buddy in Brazil who couldn’t find it there. $3.89 makes me want to go pick some up, but I digress.
[viii] I like not bringing the analogy back to oil directly, because the work Cracklin’ Oat Bran is pretty fun to read and write. Cracklin’ Oat Bran.
One of the great things about the school I went to, The[i] University of Tulsa, is that the Chemical Engineering department was full of people with pretty extensive industry experience, and they solicited feedback from different employers on what coursework might add the most value for new graduates. During my Junior year, one of the things that came out of this feedback was that graduates with a better understanding of process control, which in general terms just means automated methods of controlling things like temperatures, pressure, flowrates, levels, or other variables in a system. In laymen’s terms, you know how you can never turn the red and blue knob or the fan speed setting in your car to make the temperature just the way you like it? They taught us how to be really awesome at stuff like that[ii].
On top of a dedicated process control course, the program began adding some additional process control elements to our unit operations lab class and elsewhere. I found the detailed material in this work, which included Matlab control simulations, control tuning methods, and even the use of Laplace transforms, fascinating. However, as is the case with most problems I have faced in the real world, most process control solutions employ almost none of the really interesting stuff you learn in college outside of the functions of a basic PID controller, which are explained pretty well on Wikipedia for those of you interested. You won’t need none of that to follow along with this story though, which covers one of the simplest and most costly control issues I have battled: How operating a facility on top of a rocking boat can absolutely wreck your ability to provide stable level control.
Full disclosure, this will be a less detailed version of an internal presentation I was selected to perform at my Chevron’s annual Facilities Engineering Virtual conference, so any of my colleagues interested in more technical details should tune into that sometime in October.
For those of you tuning out because you think process control is complicated or boring, wait for me to at least explain why the former isn’t true. The example I’ll [iii]discuss today will deal with basic level control in what is typically referred to as a knock-out (or KO) vessel, named this way because it “knocks out” any liquids entrained in the vapor phase before sending vapor downstream. Controlling the level in KO vessels is generally easy as they typically only get small amounts of liquid that just need to be periodically drained off, but are designed to be large enough to handle huge monstrous slugs of liquid that don’t happen that often. Imagine you have half a glass of water that is being refilled extremely slowly, and you want to maintain it at that 50% level regardless of how much is or isn’t being poured into the glass. If you have a straw, you might suck harder as water is poured in more quickly, or more slowly if just a trickle of water is being poured in. Or, if the flow is slow enough, you might just suck a little bit out every time the water reaches some level to keep the glass from overfilling. That’s a stupid example, but it gives you an idea of the type of dumb stuff engineers can get paid barrels of money to fix[iv].
Of course, we don’t suck fluid out of our process vessels with straws, we have drain pipes equipped with valves that open and close to allow fluid to flow out more or less quickly to maintain level. When the level falls below the desired amount, we close the valve and allow liquid level to build up. When the level goes high, we open the valve to bring it back down. We typically use the aforementioned PID controller to “tune” the response of this valve so it doesn’t open or close too quickly or slowly. To make this even easier, one of our “glasses” might be 12 feet high and four feet wide, and we can usually allow our levels readings to fluctuate quite a bit one way or another before there is a significant issue, so you wouldn’t think this is rocket science.
Part of the problem is that we almost never work with the entire glass. The range of “fullness” that is typically measure between 0 and 100% is limited to a small section of the vessel that has a level bridle attached. This is because you are severely restricted in how high or low you can really allow the level to go.
On the low side, you generally don’t want the level to fall so low that the vessel is sucked dry, which could allow any high pressure gas in the vessel to shoot out the drain line and overwhelm downstream equipment. There is often a significant safety margin applied so that this level does not fall below 30-40% of the measured level range. If it does, a safety valve on the outlet will typically close, refusing to allow any more liquid to escape.
On the high side, you have a different margin applied, usually one that doesn’t allow the level of the vessel to reach the point where fluid is filling the vessel, which is often already on the bottom half of the vessel. This is because the stream of incoming liquid and vapor needs a significant amount of height to allow liquid to separate from the vapor. If the liquid level of the vapor exceeds this inlet level, the incoming flow can blast this liquid upwards through the top of the vessel, not unlike what would happen in our example glass of water if instrad of sucking you decided to blow into the straw as hard as you could. Not only does this defeat the purpose of the “Knock-out” vessel, this gas is often going to sensitive equipment that is not equipped to handle liquids. If the knock out drum is upstream of a burner that isn’t designed to handle liquids, you may at best end up damaging equipment or at worst cause a rain shower of potentially burning liquid hydrocarbon to come raining out of a facility flare. Here’s what it looks like when a refinery flare meant to burn gas is sent liquid crude:
Why, yes, that is flaming oil falling to the ground. Not exactly an ideal situation.
Knock out drums are also typically upstream of compressors, which are machines that generate pressure to move fluid by compressing gases (as their name would indicate). The problem with sending liquids to a compressor in that liquids are not compressible, and can result in severe damage to compressors. Compressor are not only costly equipment to repair, but the loss of an important compression system can bottleneck or even shut down an entire plant for an extended period of time if there are not adequate spare compressors to maintain operation.
So suddenly our half-full glass starts to look half empty, as we realize our level bridle only measured about a sixth of the vessel height, and 50% really means half the distance between a third and halfway up the vessel. Our 12 feet of height has become 2 feet, and if we intend to keep our levels between 30 and 70% of that range to provide margin, that 2 feet becomes a range of 0.8 feet from high to low.
And now we get to the rolling.
I currently work aboard a Floating, Storage, Production, and Offloading Vessel, often referred to as an FPSO. When people ask me where I work, I say it’s a boat, because that’s what it looks like. In fact, the FPSO I work on is a converted oil tanker that had all of its main oil-production related equipment added on decades after the ship was built. One end of our ship, the turret, is fixed, allowing production lines to come into the ship without twisting and snapping. The rest of the ship swivels 360 degrees around the turret. I honestly don’t know enough to adequately explain the setup in words, but here’s an excellent animation that kind of gives an idea of how it works:
Neat-o! I still have no idea exactly how it works.
One problem with working on the ship like this is that when bad weather hits, or the wind and waves push perpendicular to each other, or the boat has just offloaded a million barrels of oil and has a high center of gravity, these factors can cause the vessel to roll pretty significantly. As some of you may have seen on my Facebook, I have measured the total combined roll of the FPSO on which I work as between 15-20 degrees total, meaning the ship can roll up to 10 degrees a single direction. The motion is slow enough (about 10-12 seconds per full roll) that it hasn’t made me seasick[v], but it can make sleeping nearly impossible at times, and persistent rolling throughout the course of a day does seem to make myself and others drowsy.
Using the tangent of 10 degrees as a guide (0.176), I can see that the level at the edge of this hypothetical vessel (diameter=4 feet, radius=2 feet), can increase or decrease by about 0.35 feet. However, the level bridle measuring the fluid level can be a foot outside of the vessel. If this is aligned in the same direction of the roll, the deviation in our theoretical vessel can be up to 0.53 feet each direction, or 1.06 feet total. In this case, even if we kept our vessel at exactly “50%” of the desired range when the vessel was stable, the indicated vessel level would fluctuate between 23.5 and 76.5%, easily enough to sound a high or low level alarm every 5 or 6 seconds as the vessel rolls.
Go back to that example of the glass of water with the straw and imagine that glass slowly being rocked a few degrees to each side. You would be able to see the water level was only rising on one side and falling an equal amount on the other and would be unlikely to completely lose your mind due to this, but individual level bridles only have the ability to see one side of our glass, and it drives them nuts. The automated controller will keep opening the drain valve and letting little blurps of fluid drain out every time the level exceeds the desired setpoint, until the level settles at a low enough level that the desired setpoint becomes the high level on this peak. This means the level alternates between “good” at the high point and “unacceptably low” on the other end, which means the low safety level usually gets violated and causes the backup safety valve on the drain to close, blocking in flow and allowing fluid to enter the vessel without draining until this safety valve is reset and re-opened, or the vessel reaches a high level and shuts down the plant before we get to that whole “rain of fire[vi]” scenario mentioned earlier.
As shown above, the level controller on the right has opened the control valve to the point where the “high” side of the level is right at the desired setpoint. However, the backup shutdown valve is generally tied to a separate, redundant level safety transmitter bridle in order to preserve multiple independent layers of protection against high and low level scenarios. Although it doesn’t really matter which side I drew this bridle on since the level will fluctuate on both sides, I have shown how the level safety transmitter currently reading “too low” on the “low” side, causing the shutdown valve to close. This is not a control valve, and once it closes it will remain closed until the low condition has been cleared, often requiring an additional manual input from the control room before being allowed to re-open.
Imagine being in a control room on a ship, already groggy and perhaps queasy from trying to focus intently on managing the plant while your entire world has been rocking for hours, and all the while potentially dozens of these alarms keep coming in every few seconds. Even worse, imagine knowing that each one of these level alarms means the system is on the verge of shutting itself down due to high or low level, resulting in potentially millions in lost revenue. Here’s another thought: Imagine programming the automatic PID controller, using these levels to automate the opening and closing of the drain valve on the vessel. Without any other information, the PID controller’s programming is to open the valve as is a flood of liquid is entering the vessel every few seconds. Good luck tuning this controller to maintain that average level at “exactly” 50%. The observed change in level during one 6 second period of roll can easily be as high as the change in level during “stable” operation of the vessel was allowed to fill up on its own for minutes or even hours depending on the service. The change in level doesn’t have to be the extreme case presented above either, a roll that results in level readings that fluctuate 10 or 20% are more than enough to ruin the function of a control loop not designed to handle them. In many cases this results in the automatic control being overridden altogether, forcing the control operator to make his best guess as to what the valve opening should be to maintain a relatively constant average level.
There are a few ways this can be addressed. A dampening factor can be added to each PID controller to reduce the effect of rolling, the valves of the level bridle can be partially closed as to mechanically “dampen” or reduce the rate at which the level bridle fills during periods of roll (I wouldn’t advocate for this), or the controller loop can use a time averaged value to eliminate control overreactions based on short periods of rolling. We chose to implement the third option, as this averaging could be put in one place and tracked through our distributed control system. It’s not a perfect solution, but averaging the last two or three values reported for level allowed the controller to take into account level readings at various points in the ships roll, and the high and low numbers typically canceled each other out. This enabled many of the controllers to remain engaged in automatic control mode, as their tuning parameters were able to be adjusted without having to worry as much about rolling behavior. I’d definitely recommend this approach to anyone else who sees their alarm panel go off like a Christmas lights every time their facility starts moving.
FPSO rolling is not a new phenomenon, and I’m sure I’m not breaking new ground, or…er, water. Anyone more familiar with the topic please let me know what you’ve seen in design or operation and let me know what I screwed up in the comments.
[i] Yes, the “T” is capitalized. I never really understood why.
[ii] Although taught only as an elective at The University of Tulsa, automobile A/C knob turning is actually a standalone major at most state schools in Oklahoma.
[iii] Remember what I said about being oversized? The vessel not only has to be tall enough to allow a big slug of liquid to come in, but it is also typically sized tall enough to have some non-trivial amount of residence time for liquid to flow into the vessel at that high rate. The vessels are also wide to allow gas to flow upwards slowly, making it less likely that high-velocity gasses will carry out any sizable droplets of water.
[iv] In defense of engineers, a buddy of mine who studied computer science at Tulsa made thousands of dollars on the side providing tech support, which from what I gather consisted almost entirely of going to people’s houses to unplug things and then plug them back in.
[v] Others on our ship haven’t been so lucky. And by others I mostly mean David.
[vi] Not to be confused with Reign of Fire. Obligatory shoutout to Deepak Chetty who shaved his head to look like Matthew McConaughey in that movie. Deepak’s Hard Reset is now available on Steam. I know that nobody ever clicks any of the links I put here because WordPress likes to remind me of this, but I encourage you to check this one out: http://store.steampowered.com/app/669970/Hard_Reset/
I don’t intend to make every blog post here in my about climate change, but it’s such an interesting subject that sends so many numbers flying around that’s it’s hard for a math, science, and energy nerd like me to ignore. With that in mind, here’s something I came up with on the Methane Recapture Rule that might be wrong or right. Feel free to let me know how you think I did.
Improving the control of methane emissions is an important public health and air quality issue, which is why some states are moving forward with their own regulations requiring greater investment in recapture technology. I join the call for strong action to reduce pollution from venting, flaring and leaks associated with oil and gas production operations on public and Indian land.[i]
In terms of what this rule expected to accomplish, per a 2016 statement released by the EPA[ii], “The final standards for new and modified sources are expected to reduce 510,000 short tons of methane in 2025, the equivalent of reducing 11 million metric tons of carbon dioxide. Natural gas that is recovered as a result of the rule can be used on site or sold. EPA estimates the final rule will yield climate benefits of $690 million in 2025, which will outweigh estimated costs of $530 million in 2025.” For those of you playing along in the numbers game at home, a short ton is 2000 pounds, while a metric ton is 1000 kilograms, or approximately 2204.62 pounds. I’m not exactly sure why the EPA felt the need to mix their units between English and SI, but whatever, we can deal with that in an endnote later.
Methane and CO2 are both greenhouse gases. Although the effects of Methane aren’t as long lasting as CO2, it is generally considered about 20 times as effective of a greenhouse gas in the short term. That’s probably how the EPA figures cutting 510,000 short tons of Methane releases is roughly the equivalent of cutting 11 million metric tons of CO2 releases, unit goofiness notwithstanding. Assuming all this Methane was simply burned and released as CO2 would mean the savings were closer to 1.27 metric tons worth of CO2 releases.[iii]
My question is do these numbers make sense in the first place. The EPA release says the 510,000 short tons represent a 40-45% reduction of Methane releases based on 2012 levels, which would indicate that the US released somewhere around 1.2 million short tons of Methane that year. My first thought is to convert short tons to a number I care about, Standard Cubic Feet (SCF). To do this, we can multiply the number of lb-mols of Methane (63.75 million per footnote iii) by one of my favorite oil-industry conversion numbers that everyone should know: 379.5 SCF/lb-mol. This gives a seemingly crazy 24.2 Billion SCF of Methane releases in 2012. That number seems a little less crazy when you see that the US produced 25.3 Trillion SCF of gas in 2012[iv], in fact, a leak rate of <0.1% seems almost admirable. Of course, this also seems like a shamelessly SWAG’ed result which simply assumes a leak rate of 0.1%, especially since quantifying actual Methane leak rates is a notoriously difficult proposition – Almost as difficult as it would be to come up with the data to support the assertion 40-45% of those leaks can be recovered at a cost of 530 million dollars.
So how about those cost figures? If you assume that both the $530 million cost and $690 million benefit values are correct, then the rule has a healthy environmental profit margin of 30%. Of course, if I understand correctly, the O&G industry is footing the bill, so the only real case to be made is that this rule makes more sense than simply applying a $530 million dollar tax and deploying the proceeds towards carbon capture and sequestration (CCS) efforts.
Let’s start with the value driver, that $690 million dollars in 2025. Divide that number by the aforementioned 11 million metric tons of CO2 and you get a cost of about $63 per metric ton of CO2. If this is really the cheapest cost of CCS foreseen in the year 2025, then perhaps the rule makes sense economically. However, cut this cost down to $48/metric ton or less and your value driver vanishes, and you would be just as well off spending the 530 million on the cheapest available CCS technology.
Trying to Google the actual cost of CCS appears to be a difficult exercise, one that I don’t wish upon other people. Different applications of the technology in different scenarios will give many different results. The best resource I could find appears to be the IPCC Special Report on Carbon dioxide Capture and Storage, but it would suggest that for $48/metric ton you might find better value in applying CCS to new power plants. In addition to the IPCC work, a recently published Wall Street Journal article on peak oil demand showed that many oil companies are building in a cost of $30-$40/metric ton of CO2 into their future business plans, well below both the breakeven point of $48 that makes the rule profitable.
As for that $530 million number on the other side of the equation…I’m not even going to try to understand where that came from. I would be more inclined to believe the actual costs of compliance with the new regulation to be more than advertised, not less, but that’s just me editorializing on how I view the salesmanship of this particular rule. If you take the cost as stated, the math doesn’t seem to quite line up.
There’s obviously a bit of politics in play here as well (duh). It’s easier to pass a regulation advertised as low hanging fruit in the fight against climate change than to pass an actual Carbon (or in this case, Methane) Tax. The proof here is that the former was actually possible and done, while the latter appears to have very little chance at coming to fruition in the current political climate. With this in mind, an effort to do “something”, even if it does not make the most sense, trumps the desire to do the most correct thing. Also, not to be a downer, but while this number seems large, the actual carbon-offset potential of this regulation is equal to cutting Natural gas burning by less than 1% of the 2012 US gas production rate (40-45% of 20 times 0.1% of the US’s domestic gas production in in 2012). On a global scale, half a billion dollars, regardless of how it is deployed, doesn’t do a whole lot in terms of CCS.
[iii] 510,000 short tons equals 10.2 billion pounds of Methane, or 63.75 million lb-mols of Methane (molecule weight=16). Given that every lb-mol of Methane would stoichiometrically create 1 lb-mol of CO2, burning this amount of Methane would create about 28.05 billion pounds of CO2 (molecular weight=44), which converts to 1.27 million metric tons.