Do you ever hear someone that you agree with use a terrible argument in a debate and shudder? Their position is the same as yours, but they’ve just used a questionable or downright misleading premise to back it up, weakening your position by association and opening you up to straw-man attacks. Now you’re locked into a debate within a debate, and nobody seems happy.
I’ve been there, on both sides. I’ve repeated some talking point I picked up without checking it first only to get called out, then furiously do 15 seconds of research on my phone that only confirms I’m wrong, then end up ashamed that I blindly accepted an argument just because it seemed to perfectly line up with the point I was trying to make. Why couldn’t I have just used a better argument?
I guess fake news is catchy on a Facebook feed, but that’s not the only culprit here. Real news, or “technically accurate” arguments presented in a way that is clearly misleading to people who are familiar with the area can be even worse. So I’ve decided I’m going try to call out some of these bad arguments and offer better substitutes in a series I’ll call “Say this, not that,” inspired by the popular healthy eating guide (Although more often than not I still choose “this” over “that” when it comes to their suggestions).
Today’s topic is a jobs-related talking point in favor of solar energy that has come up recently following President Trump’s recent decision to put a 30% import tax on solar panels among other things. I have discussed this topic before (these assertions are mostly based on energy job analysis that is a year old), but the headlines I keep hearing repeated seem to be particularly egregious now and increasingly cited without regard for the full content of the underlying articles or the broader energy picture.
Not content to merely indicate that the U.S. solar industry has created a lot of jobs (supporting a substantial 260,777 workers that spend greater than half their time on solar projects and an additional 113,730 jobs where people spend some portion of their time on solar projects), what I now hear is that Solar represents “more jobs than oil, gas, and coal combined.” This argument is not new and was already true last year, if limited to jobs relating to electrical power generation, as noted in this Forbes article. Other outlets such as like IFLS, ran with a headline reading “Solar Employs More People Than Oil, Coal, And Gas Combined In The US”. Other offenders were the Natural Resources Defense Council (U.S. Clean Energy Jobs Surpass Fossil Fuel Employment), The Independent (US solar power employs more people than oil, coal and gas combined, report shows).
Don’t get me wrong, that solar is employing such a large percentage of the electric power generation workforce is impressive, even if these jobs aren’t creating the most energy per job (that’s a different topic that I beat to death earlier and you can read about here). However, the number of solar jobs overall aren’t even close to the number of jobs that oil and gas creates because most oil and gas does not go into electric power generation. This is because, electric power generation only represents a relatively small slice of the US energy picture.
A few sources[i] peg the United States’ total electrical energy consumption from all sources at around 4,000,000,000,000 kilowatt hours (abbreviated kW-hr) per year. That’s the number four followed by 12 zeroes, and for reference a 60 watt light bulb would theoretically consume 1 kW-hr about once every 17 hours. Even converted to barrels of oil equivalent, this is an impressive 2,400,000,000 barrels per year, or about 6.5 million barrels per day. However, it is still important to note that despite creating a large number of jobs, for the 12 month period ending October 2017, Solar power in the US has had only produced 51,800,000,000 kW-hr, or a little over 1% of annual electric consumption in the US. Here’s a graph that show’s how production numbers break down[ii].
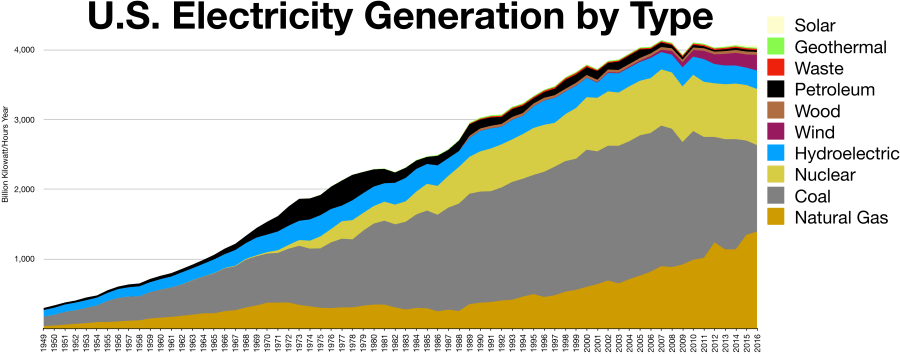
If my math is right, Solar’s production is the rough equivalent of 83,500 barrels of oil per day. For comparison, the U.S. consumes close to 20 million barrels of actual oil per day (about a fifth of the total world consumption) and is expected to produce over half that amount. In addition, the US consumes about 27.5 trillion standard cubic feet of natural gas, about 13 million barrels of oil equivalent per day, and is projected to produce even more gas than it consumes.
As for how absurd the lack of the qualifier “electric power” caveat skews the jobs argument: For US jobs overall, Oil supports 502,678 jobs, only 12,840 of which are associated with electric power generation. Natural Gas supports 392,869 jobs, only 88,242 of which are associated with electric power generation. If you want to see all the numbers yourself, they’re actually presented in a really clear fashion in the Department of Energy’s U.S. Energy and Employment Report published in January 2017 (link), which I would note is the same report on which all of the aforementioned articled were based.
This is where I should probably mention that article headlines are engineered to be clickbait, and in most media aren’t even written by the author of the story, but instead by people marketing the story in a way that attracts the most viewers.
So for this round of debate on the 30% tariff on cheap solar panels from China, please don’t tell me Solar generates more jobs than Oil and Gas, that is wrong. Don’t even tell me Solar generates more jobs within the electric power generation sector, which while technically correct sounds weak and opens the Solar industry to (unfair) attacks of lagging efficiency on a per job-basis. Instead, mention that the Solar industry already employs hundreds of thousands of Americans and is still growing incredibly quickly. Mention that solar power emits no CO2. Mention that Solar could provide a way to eliminate many of the environmental and safety risks associated with hydrocarbon exploration and production; Curtailing the need for energy firms to explore production of sources areas that are controlled by hostile governments, or that are environmentally sensitive, or contain oil that is costly or dangerous to produce.
Most importantly, acknowledge that there are no silver bullets to the world’s energy issues, and listen to the people you are arguing with, even if they seem like your ideological opposite. They probably have some good points and ideas too, and in my experience people are much more likely to consider your evidence if you hear them out first.
[i] http://bfy.tw/GETM Yeah, I’m feeling that lazy with the endnote references today.
[ii] By Wikideas1 -https://www.eia.gov/totalenergy/data/annual/showtext.php?t=ptb0802ahttps://www.eia.gov/electricity/monthly/, CC0, https://commons.wikimedia.org/w/index.php?curid=64602758